
It’s not always possible to get your hands on some really good chart software, as a matter of fact – I recently blogged about some top flowchart software in the market, and while there is variety – I’m pretty sure there are those who prefer something more native to the web.
I look at charts and graphs as a way of publishing higher quality content, and not just because I want to, but because it has been proven / known that visual content is far more appealing than just several walls of text.
I’m naturally using something very easy to use, when it comes to building diagrams – I’m a believer in saving time, and not overdoing something for the sake of making it look extraordinarly good. And, while these JavaScript libraries might seem like a real pain in the neck to get them going – they’re one of the nicest ones I’ve ever seen.
Who needs software for building charts and graphs, when you can use JavaScript to generate beautiful, and custom graph layouts. Integration is as easy as wrapping some ‘div’ tags together!
1. Flotr2
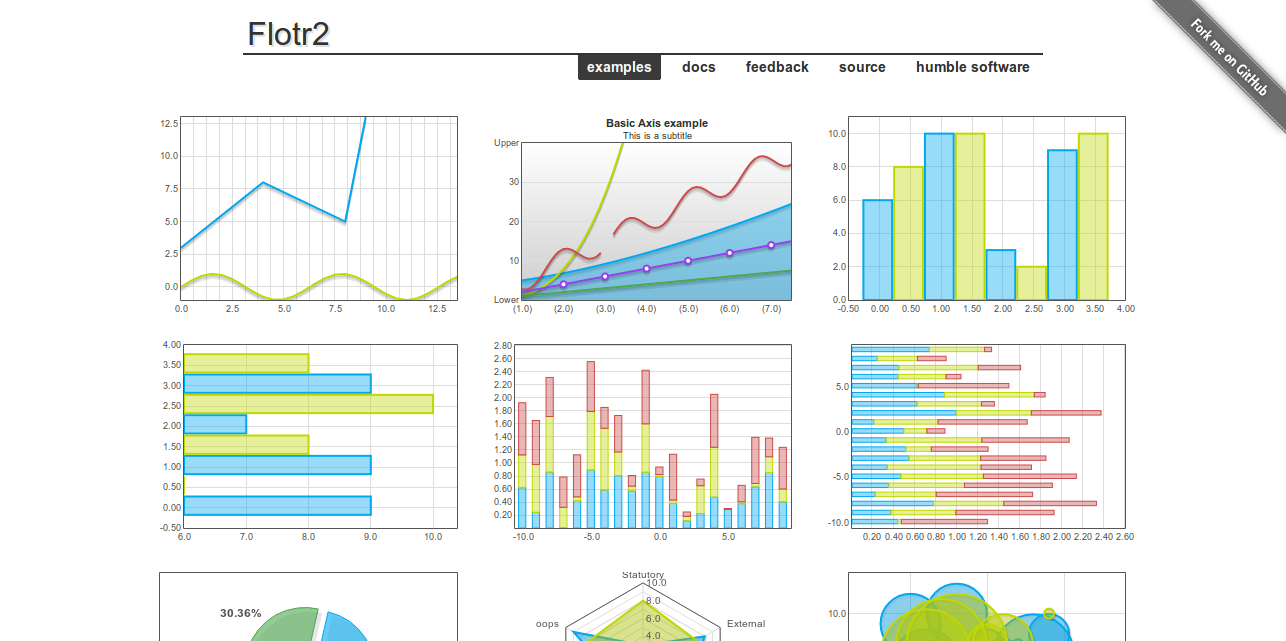
The team behind Humble software have been building visualization, graph applications for quite some time now. Their Flotr2 library is one of the most popular ones, as it offers a great deal of pre-made examples that are both easy to setup, and understand even for the beginner user.
I also like the fact that you can extend the library by adding your own graph types, and even your own plugins to take it to the next level. Now, it is built for Canvas (HTML5) and so integration with mobile devices is seamless. It supports IE6+.
2. Springy
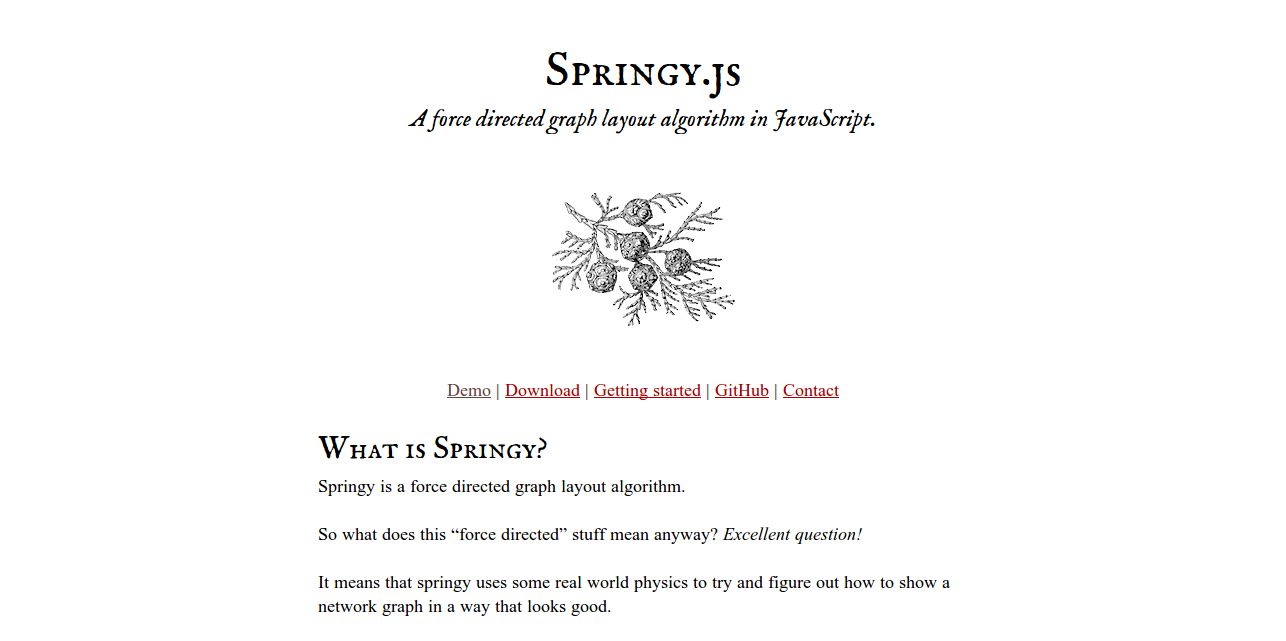
Springy is a force directed graph layout algorithm. It means that springy uses some real world physics to try and figure out how to show a network graph in a way that looks good.
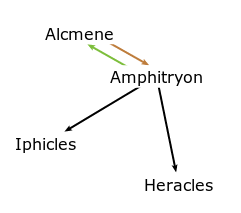
It has a fairly easy API to work with, and it generally isn’t hard to understand, just take a look at the source code to get a feel of it. You can also check out a more advanced demo, for connecting shapes.
3. xCharts
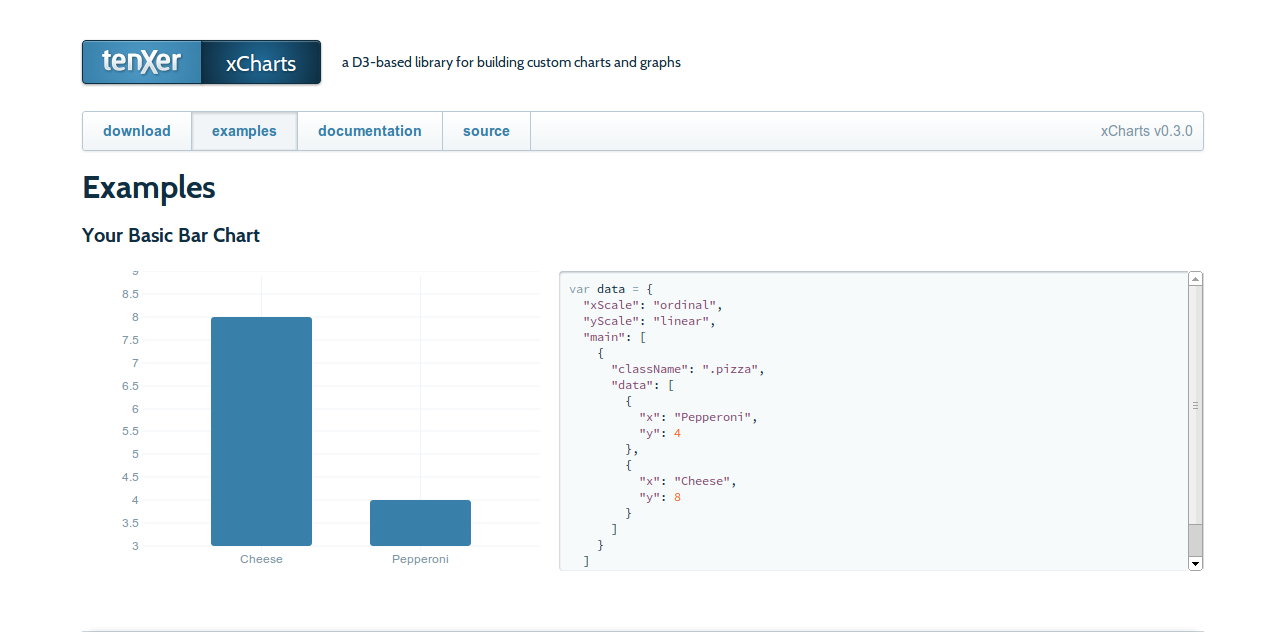
xCharts is a JavaScript library for building beautiful and custom data-driven chart visualizations for the web using D3.js. By taking the advantage of combining HTML, CSS, and SVG – this library makes chart creation and integration incredibly easy and fun.
With this library, you can build data-driven data graphs literally in minutes! Try out the demo page, and see what it is capable of. I’m really liking the flat design so far.
4. Rickshaw
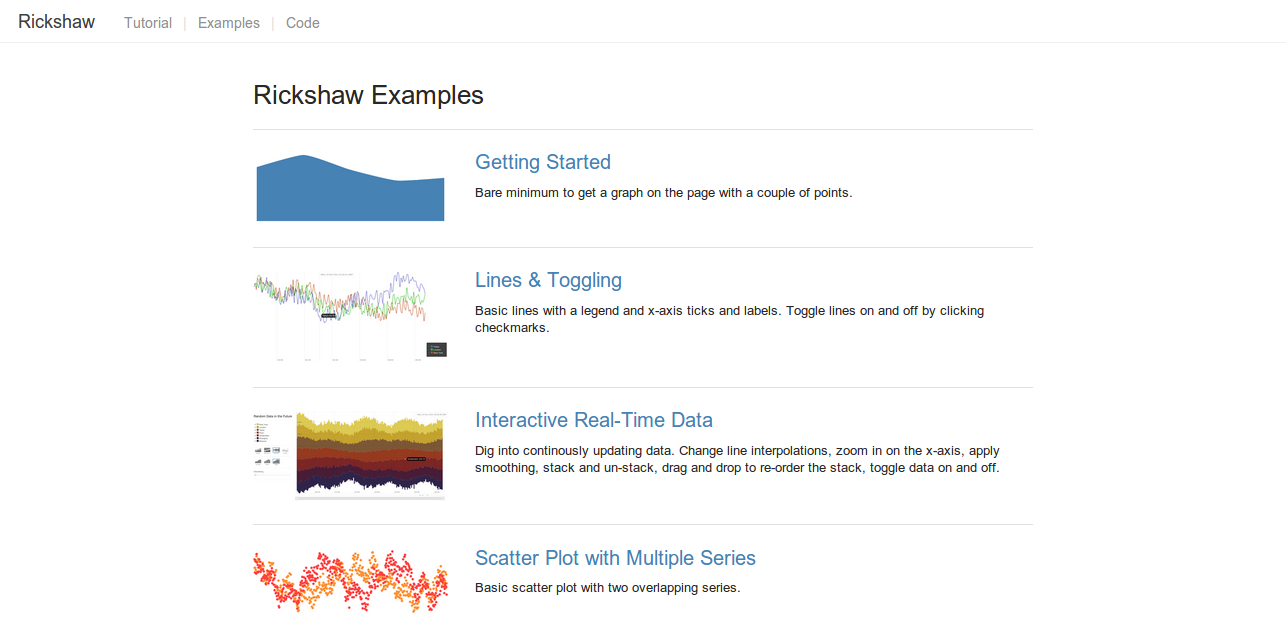
Built by the stock photo giant Shutterstock, Rickshaw is a JavaScript toolkit for creating interactive time series graphs.
Rickshaw is another successor of D3, and tries to make creating graphs an effortless thing. You can easily manipulate D3, and even SVG from within the framework’s base – it’s all accessible and easy to use.
I’m really liking the depth of the multiple renders demo, and take a look at the source of that page, to see how easy it all comes together.
5. Ico
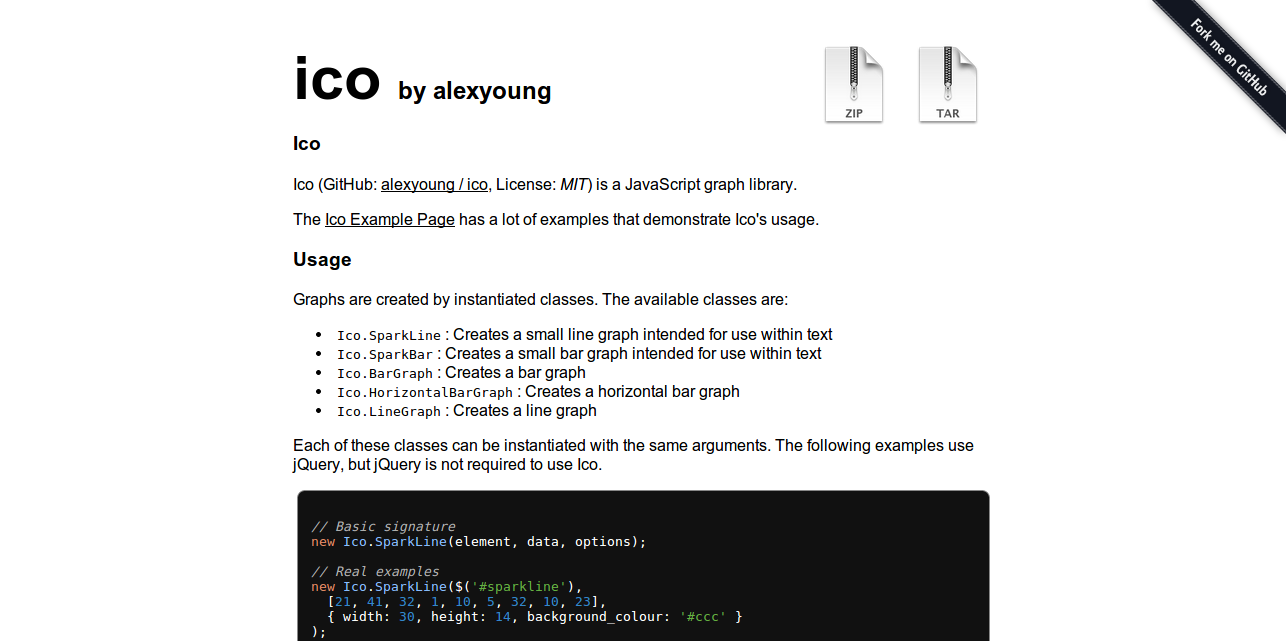
Ico is a JavaScript graph library that uses Raphael to draw. This means it can draw graphs in multiple browsers (including IE). I really like how compact both the code, and the examples are.
You can build all kinds of graphs with Ico, and focus is heavily being put on simplicity. You’ll need Raphael to get this going.
6. Flot
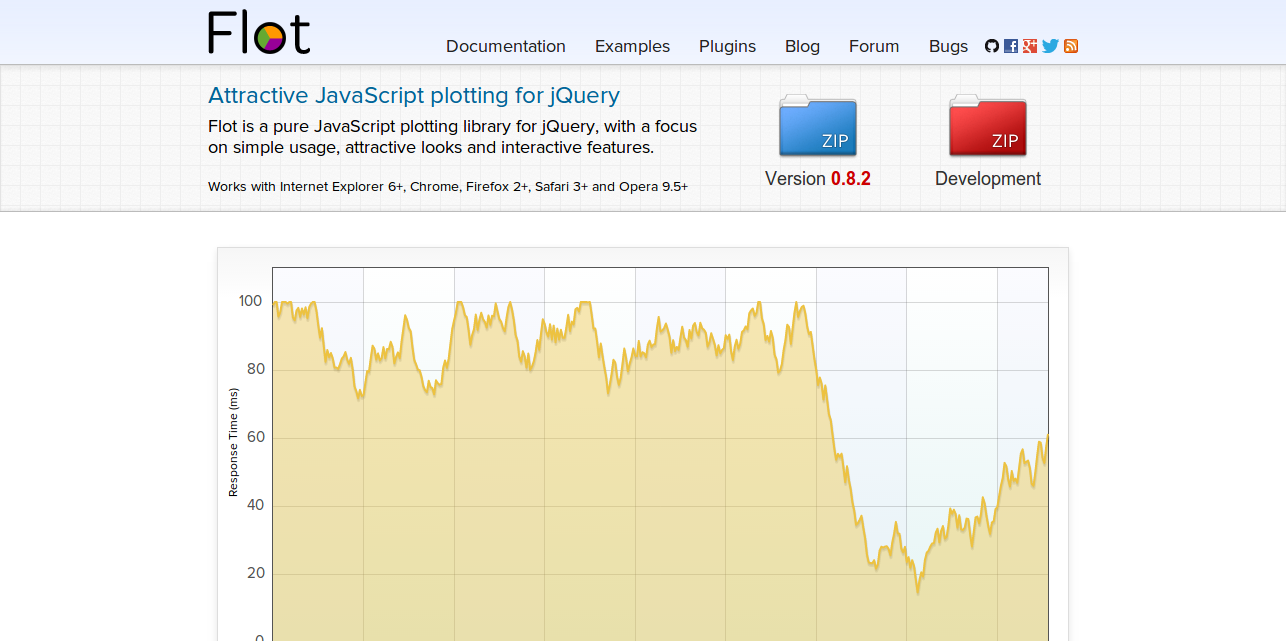
Flot is a pure JavaScript plotting library for jQuery, with a focus on simple usage, attractive looks and interactive features. It’s actually built for jQuery, but I’m including it in the list as it does provide some really nice features.
Like for example, the ability to stack graphs together, zoom-in and out – directly from the viewers page, though you do need additional plugins to get it working.
Overall, there’s a great deal of interactivity happening with Flot, and that’s what I like the most!
Charts & Graphs Libraries Built on JavaScript
It took me some time to put these together, I’d definitely appreciate some feedback and perhaps some of your own demos of how the usage of these tools can be extended? While I didn’t intend to find any more of these, you’re more than welcome to share your own favorites.
We could see that D3 and Raphael are dominating the list quite a bit, but that only tells us that those are great tools / communities to work together with.
I think your missing a few, Highcharts being one.
High charts is the best IMO. Problem with most is that they start to choke on large datasets and there aren’t m/any 3D options.
Google Graphs??
May I add our library TeeChart: http://www.steema.com/files/public/teechart/html5/v2012.12.14.1.4/demos/
What about dimplejs? Any opinions? I’m beginning to use it now for a project…
Also, you can try amCharts http://www.amcharts.com/
d3
How can the list be complete without FusionCharts?
I’ve tried VanCharts in many projects and works pretty well.
Home:http://www.vancharts.com/