

Advanced data mining and data storage solutions have provided businesses with access to large and complex data sets. Modern NoSQL database solutions as well as other big data storage and processing technologies enable modern businesses to tap into large data sets. But, an important challenge for companies is to analyse this huge amount of data and organize it in a logical way for applying business logic. This is where data visualization comes in to picture. Data visualization is the scientific way of presenting valuable information through visuals, such as pie charts, statistical diagrams, timelines, chord layouts, maps and more. Data visualization helps transform large data which is available in tabular format in to something visually interactive, which allows focusing on relevant and interesting data.
Big data analytics and visualization is adopted by large and small companies for discovering new business insights, identifying crucial patterns and analysing trends. Most of the companies rely on modern and enterprise-level software applications which are capable of delivering modern business intelligence and data visualization solutions. Alright, so here I am listing down the names of 9 such software applications which are key players in the fields of data analytics and data visualization. So, let us check out the list of 9 data visualization tools for enterprises. Here we go.
1) Tableau
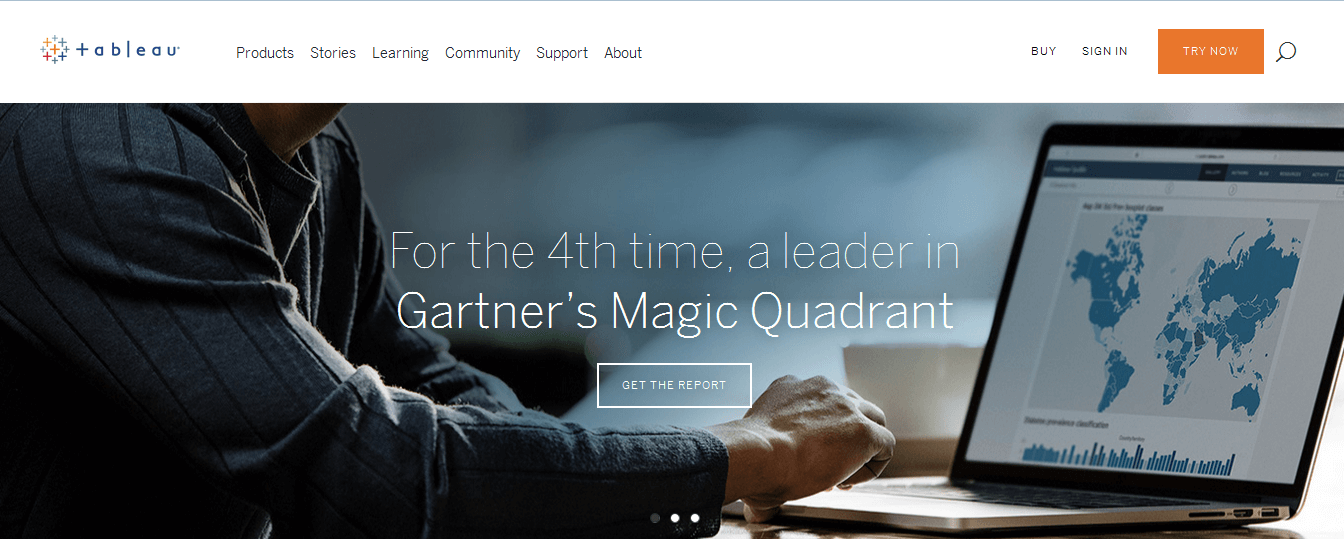
Tableau is a modern software application which provides business intelligence and data analytics solutions. The application comes in three different versions for desktop, server data and cloud data analytics. It also has very good documentation and other educational resources. Tableau is widely used for creating interactive data visualizations by organizations from diverse sectors, such as education, health care, media, finance and more.
2) IBM Watson Analytics
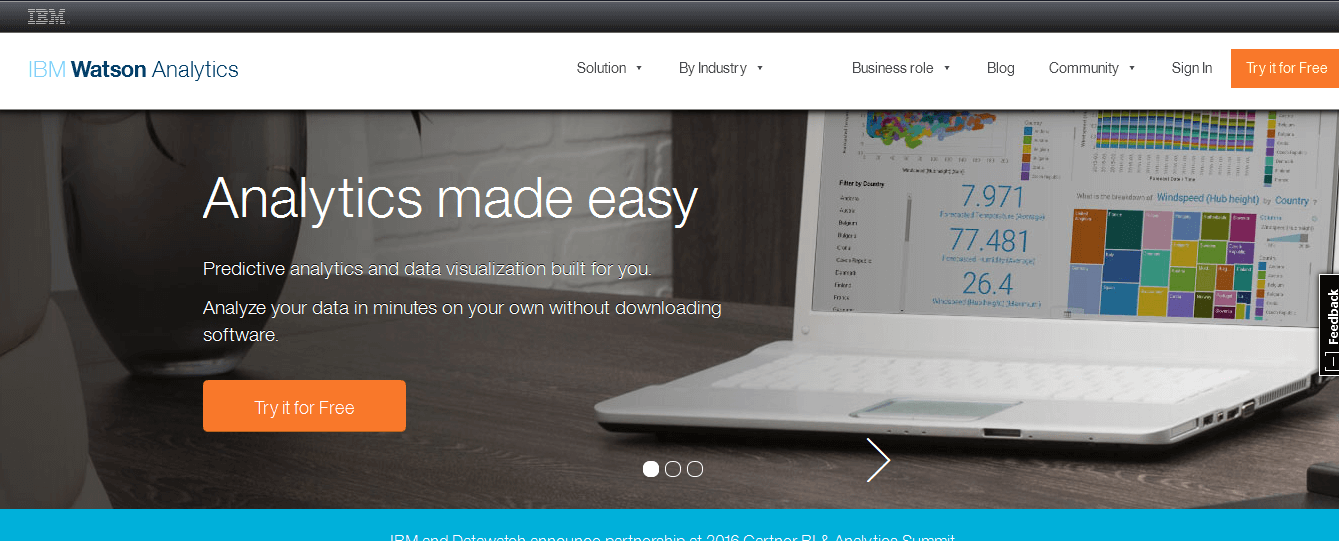
IBM Watson Analytics is an advanced data analysis and visualization tool for small and large businesses. It provides excellent predictive analysis and data visualization solutions as well as cloud-based data discovery and exploration services for a range of industry areas, such as finance, operations and human resource. IBM Watson Analytics is used for creating insightful business presentations, discovering new business insights and identifying interesting patterns and trends.
3) QlikTech
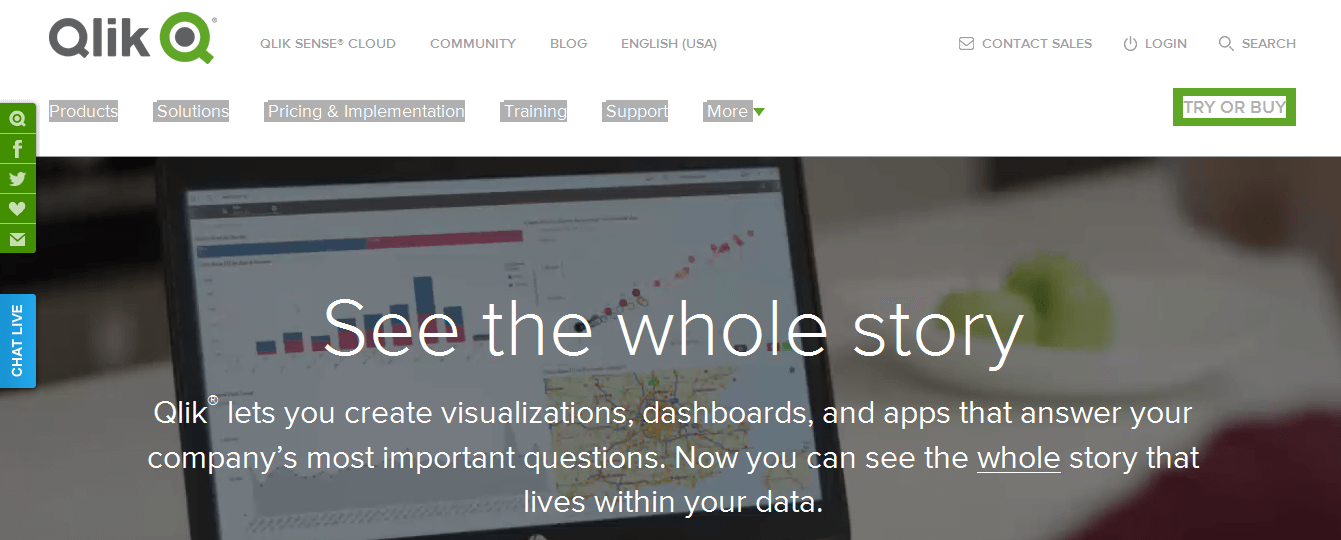
QlikTech International is a US-based software company which provides Qlik Sense, a data visualization software product. Qlik Sense allows interacting with large data sets to create effective data visualizations, dashboards, Infographics and applications. The application provides a simple drag-and-drop feature which allows creating data visualizations without complex SQL queries. Qlik Sense is used in conjunction with QlikView, which is QlikTech’s analytics tool.
4) Alteryx
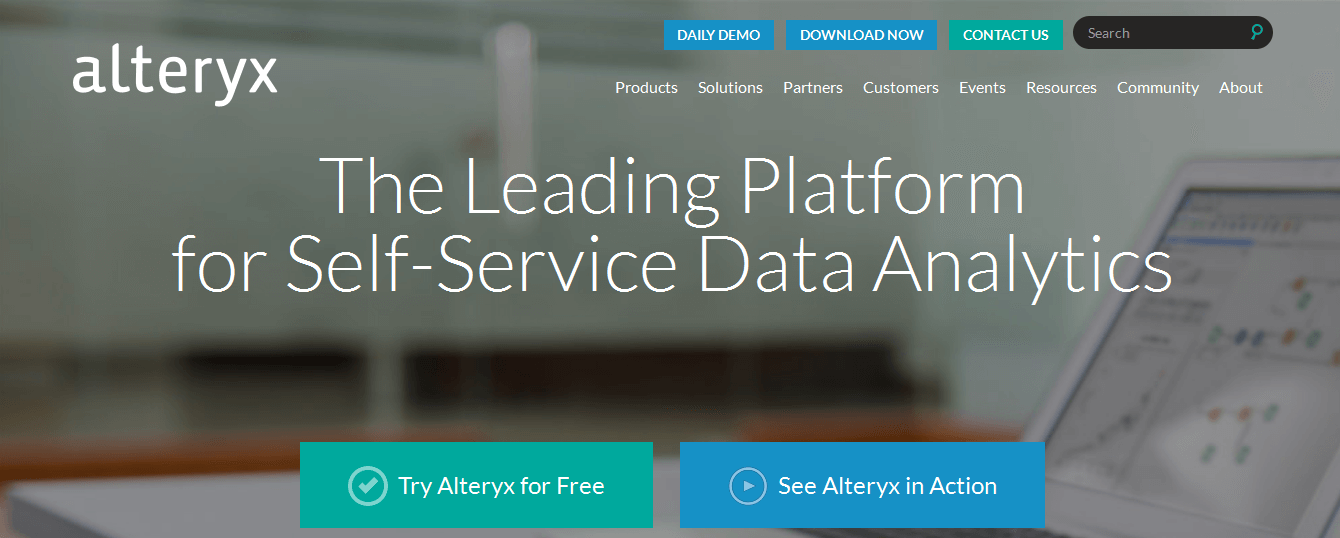
Alteryx is a modern data mining, preparation and visualization tool. The tool allows creating customized analytics applications as well as deploying and sharing analytics on server. Alteryx integrates with other popular data visualization tools like Tableau. The application also offers other services, such as data blending capabilities, predictive analytics and cloud features.
5) FusionCharts

FusionCharts is a robust JavaScript charting library which provides a comprehensive collection of JavaScript charts, maps and widgets. The library features 90+ chart types and 1000+ maps, which allows creating basic as well as complex data visualizations based on pie charts, column charts, Gantt charts and more. FusionCharts integrates with other libraries and frameworks, such as jQuery, React.js and Angular.js.
6) Maptive
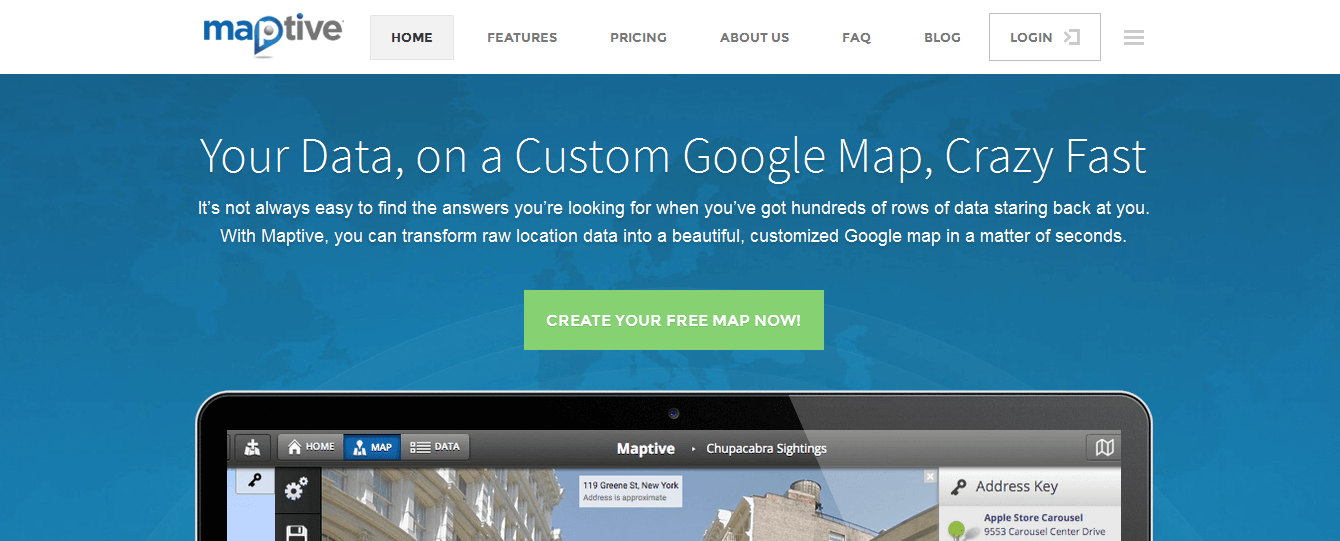
Maptive is a powerful mapping tool for transforming raw location data in to a customized Google Map. The tool efficiently handles large data sets to allow mapping thousands of locations. It also provides excellent cloud capabilities and integrates with smart phones and tablets which allow updating Google Maps in real-time from anywhere. Moreover, Maptive has good customization features and allows sharing maps on the web or embed them in to web applications.
7) MicroStrategy
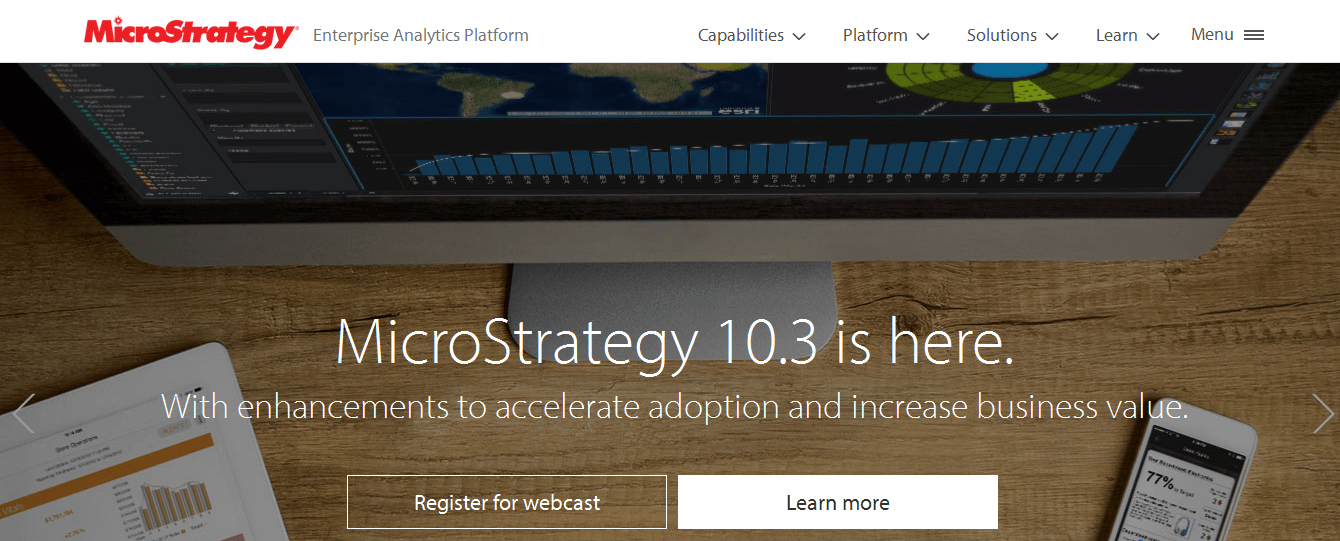
MicroStrategy is an enterprise-level analytics platform providing data visualization tools, cloud capabilities and mobile-friendly solutions. MicroStrategy allows creating insightful and interactive data visualizations in the form of heat maps, bar and pie charts, area charts, maps and graphs. The platform also offers modern business intelligence solutions, reporting tools, dashboards, data discovery and more.
8) D3
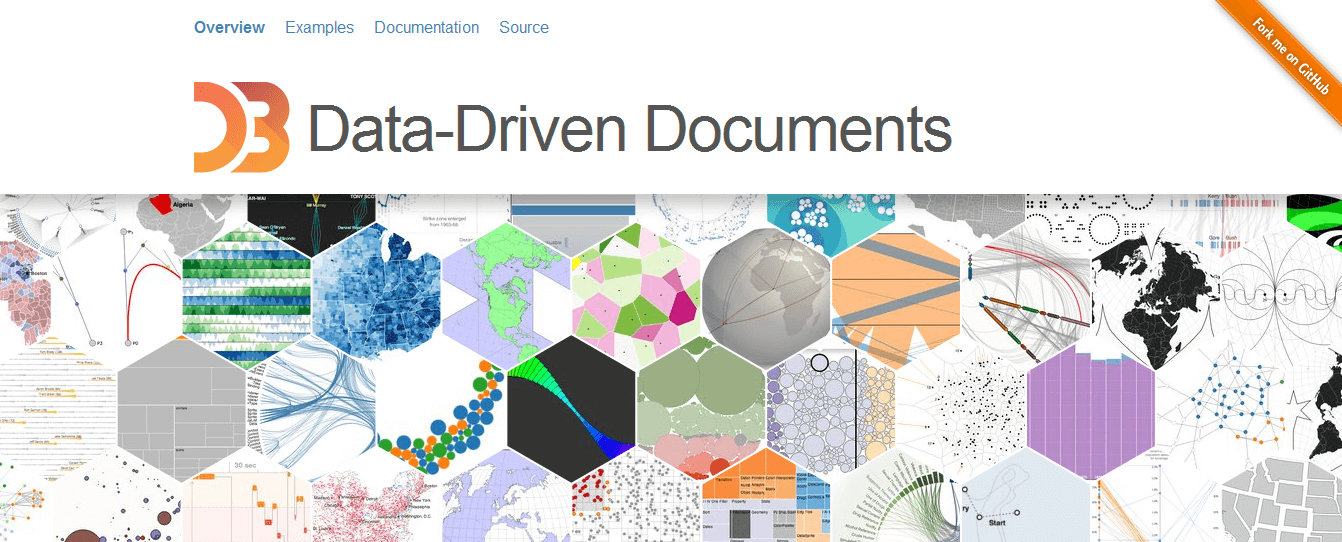
D3 or Data-Driven Documents is a modern JavaScript library which uses HTML, SVG and CSS to provide big data visualization. D3 allows attaching data to DOM (Document Object Model) elements and provides zooming/panning features. The library can also be used for building custom frameworks for data visualizations. D3 provides support for a range of layouts, such as bundle layout, chord layout, timeline and more.
9) Plotly
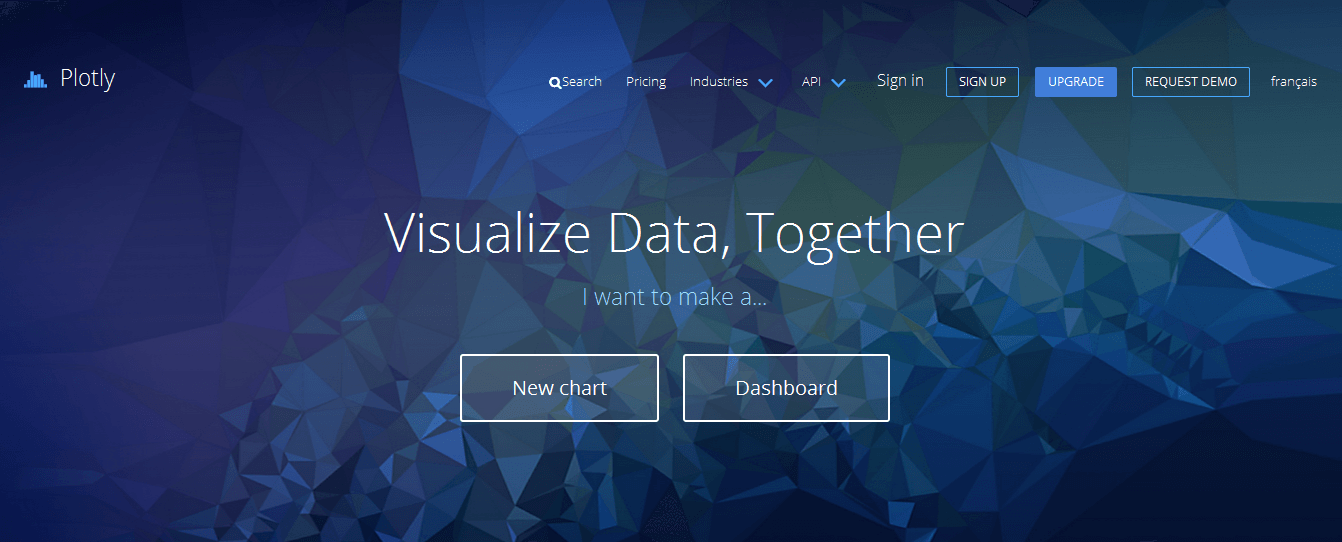
Plotly.js is a free and open-source JavaScript charting library which is used for visualizing data through various ways. The library allows creating statistical and engineering charts, 3D surface plots, complex and 3D charts, SVG maps, histograms and more. Plotly.js provides APIs (application programming interfaces) for using modern data science technologies Python, R, JavaScript and Mat lab. It also provides other amazing features, such as dashboard creation and web application designing, Excel reporting and Ad Hoc analysis.
Conclusion:
Modern businesses can leverage the power of advanced data visualization software applications to gain maximum business intelligence insights. It is important for large enterprises to choose a robust tool which has intelligent data analysis and data visualization capabilities which can empower businesses with useful information and help them to make improved business decisions. If you want to share any feedback, then kindly write our comments in the comment section below. Thank you.
Let me also add to this list another 2 projects:
1) FancyGrid – JavaScript grid library with charts integration and server communication.
2) ZingChart – the best JavaScript Chart library.