

[box type’info’]
In data processing, a pivot table is a data summarization tool found in data visualization programs such as spreadsheets or business intelligence software. Among other functions, a pivot-table can automatically sort, count total or give the average of the data stored in one table or spreadsheet.
It displays the results in a second table (called a “pivot table”) showing the summarized data. Pivot tables are also useful for quickly creating unweighted cross tabulations. The user sets up and changes the summary’s structure by dragging and dropping fields graphically.
This “rotation” or pivoting of the summary table gives the concept its name.
[Read more on Wikipedia…] [/box]Everybody who has ever touched a computer knows what Microsoft Office is, and more importantly, what Excel is. It’s the standard program / software used in schools to help students learn, create reports and even gain degrees. It’s very rare to see schools use software other than Microsoft, when it comes to Windows PC’s.
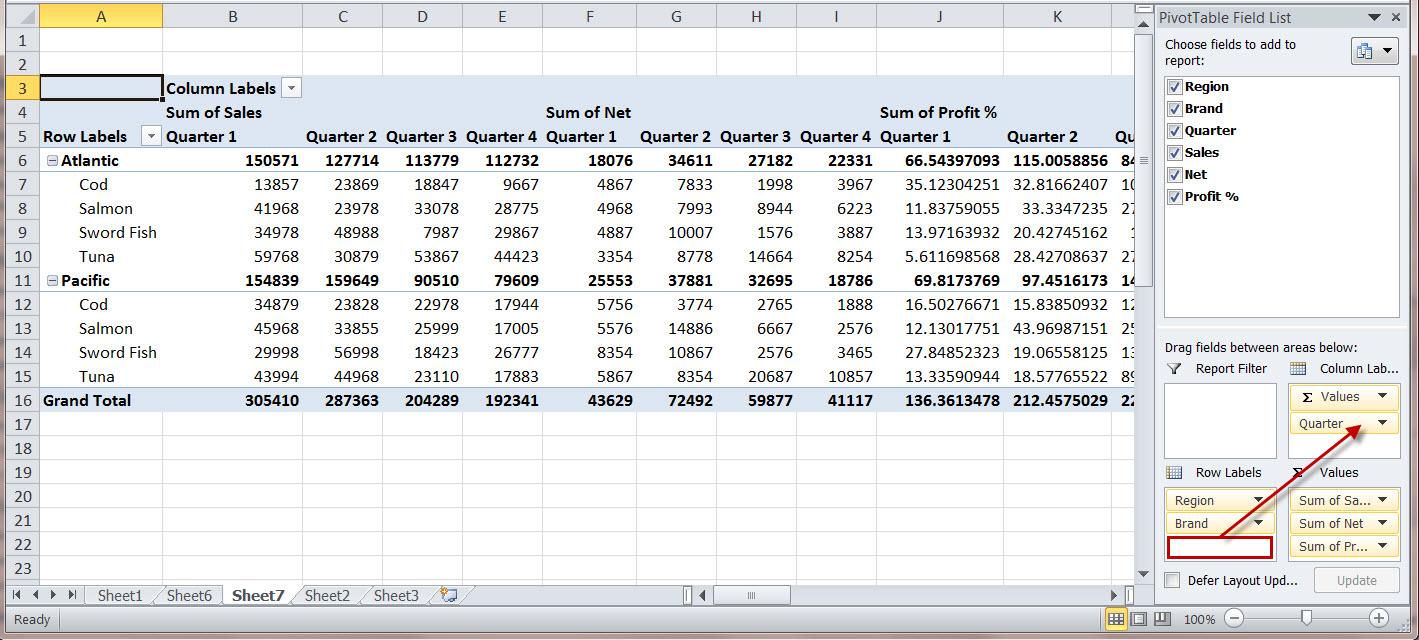
Pivot Table’s are extremely useful when it comes to putting together data, and then manipulating that data in order to build predictions, or simply view a report at the end of the month. It can be a little bit daunting, and even difficult to build one yourself, and so I’ve gathered up of what I believe are the three of the best tutorials on the web, on how to create a pivot table in excel.
They’ve been carefully chosen, and will work for Microsoft Excel versions of 2003, 2007 and 2010.
How to Create a Pivot Table: A Step-by-Step Tutorial
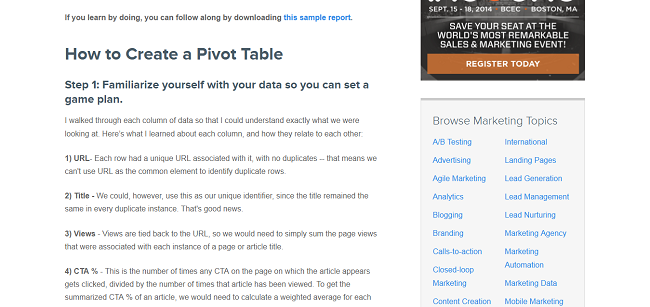
The first tutorial comes from HubSpot, it’s also one of the most recent ones that have been published, and is fairly up-to-date with new standards and how a pivot table should be created in Excel.
Matthew Wainwright goes over the little details that are necessary to create a fully functional pivot table, and he manages to break it down into four separate parts. There is also a sample report available for download, if you’re someone who prefers to learn offline.
It’s one of the easiest tutorials I’ve seen, and if you’ve been worried until now on how to make one, don’t be anymore.
Learn to use Pivot Tables in Excel 2007 to Organize Data
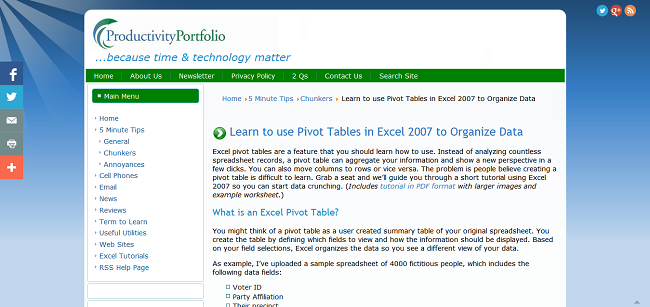
The second one comes from TimeAtlas.
This is a specific one, created for those who’re using Excel 2007. It’s incredibly detailed, and also includes a PDF file for those who’d like to learn elsewhere, other than online. You’ll come to understand the structure of pivot tables, and how to organize multiple data points.
It’s broken into five parts, and there is a total of thirteen points to go over before you’ve finished your demo pivot table. It’s a really great tutorial for both beginners and experienced excel users.
How To Create And Customize Pivot Tables In Excel [VIDEO]
![How To Create And Customize Pivot Tables In Excel [VIDEO]](https://codecondo.com/wp-content/uploads/2014/03/How-To-Create-And-Customize-Pivot-Tables-In-Excel-VIDEO.png)
This tutorial from Annie Cushing goes back a few years, but it’s still a very useful video from which to learn the art of pivot tables, and how to create them. I know that some people prefer watching a guide video when it comes to these technical things, and so I’ve decided to close the post with a 12 minute video that will explain everything about pivot tables and how to get them done like a pro!
Annie is a great narrator and guide, and you’ll hindsight find that it’s incredibly easy to learn from her! Plus, you can always head over to her blog and leave a comment if you’re having trouble with the tutorial, which you shouldn’t. :)
Creating a Pivot Table in Excel
I hope these tutorials will help you better understand pivot tables, and how to create them. There is enough variety and resources, and I wasn’t sure it is necessary to go into full detail about the technological aspects. You can always check out Excel 2013 for Dummies, which also includes a ton of resources and guides on how to create stuff with Excel.