The Role of Data Science in Minimizing the Impact of the COVID-19 Pandemic
Even in the best of times, when it comes to public health, data collection and analysis is an extremely difficult task. This especially rings true in the current condition, during a worldwide pandemic, when the data scientists are expected to perform and produce results in real-time for analyzing COVID-19 with data science. The actions of various professionals depend on answers provided by data.
Healthcare workers need to know if their institutions’ capacities will be able to deal with the expected number of patients. Business owners must have an estimate on the length and depth of the crisis to plan their activities regarding the potential decrease in revenue, keeping jobs, and managing credit lines. Government officials need to determine restrictions, budget allocations and future steps after the pandemic is over. Finally, all of us want to have precise and clear information on the spread of the disease, especially concerning our expected behavior and safety recommendations during the crisis. It seems that now more than ever, data science plays a huge role in shaping our lives.
How Can Data Science Help During the Pandemic?
Provide an Accurate Picture of the Current Pandemic Development
At the moment, thousands of data scientists all over the world are working on gathering and organizing data on the spreading coronavirus. The situation literally changes daily. It’s essential to provide healthcare professionals and governments with up-to-date information so they are able to adjust their responses. Some data organizations are releasing interactive databases that offer constant real-time insight into the virus’s behavior. These databases contain information on confirmed cases, recoveries, and fatalities. They also provide information on the age, sex, and health of the infected patients. It helps determine which population is at most risk of contracting the virus and which has the highest mortality. All this data enables medical workers to prioritize and determine the right means of protection.
Help Interpret the Information
There’s an enormous amount of data arriving, seemingly every minute. One of the jobs of data scientists is to interpret all that data and make it understandable. It’s important that the experts from other areas, such as medicine (particularly epidemiologists and virologists) and the economy are able to make sense of all the available information. Also, the general public has a right to be informed in a clear and convenient way. Using their experience and expertise, data scientists can create visual models and infographics containing pandemic data that are easy to understand and visually appealing. Sharing the correct information is essential in times when there is a lot of false news and misinterpretations coming from various media and social networks.
Our Findings
Avenga data science team took part in Roche UNCOVER Challenge and conducted data science analysis on the basis of datasets extracted from 20 global sources to answer key questions concerning coronavirus pandemic.
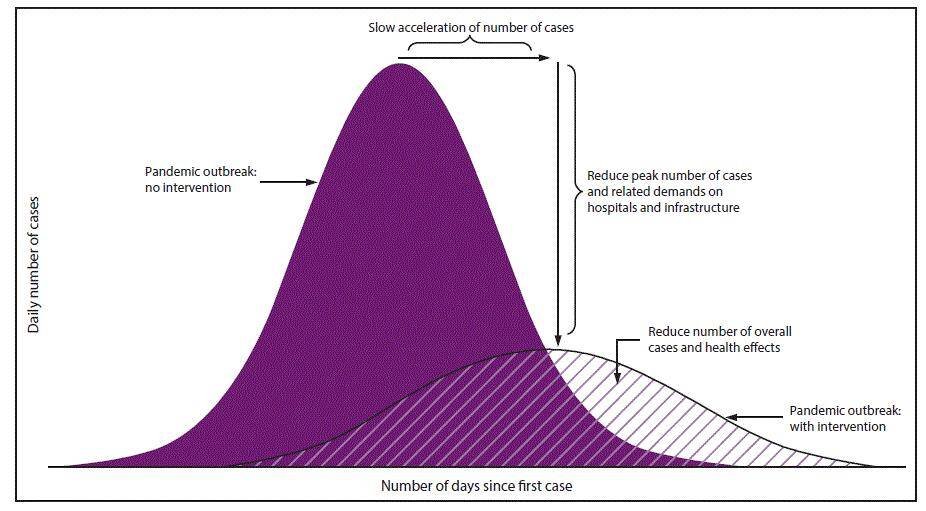
The image below shows the epidemiological curve. The purple color curve shows the disease outbreak with no preventive measures, like social distancing and instant tests. We can clearly see the purple color curve scales dramatically and is far beyond the capacity of the healthcare system and has a dramatic number of cases and deaths. However, the stripy curve shows what is called “flattening the curve”: introduction of the preventive measures lowers down the number of cases and death, so they can be handled effectively.
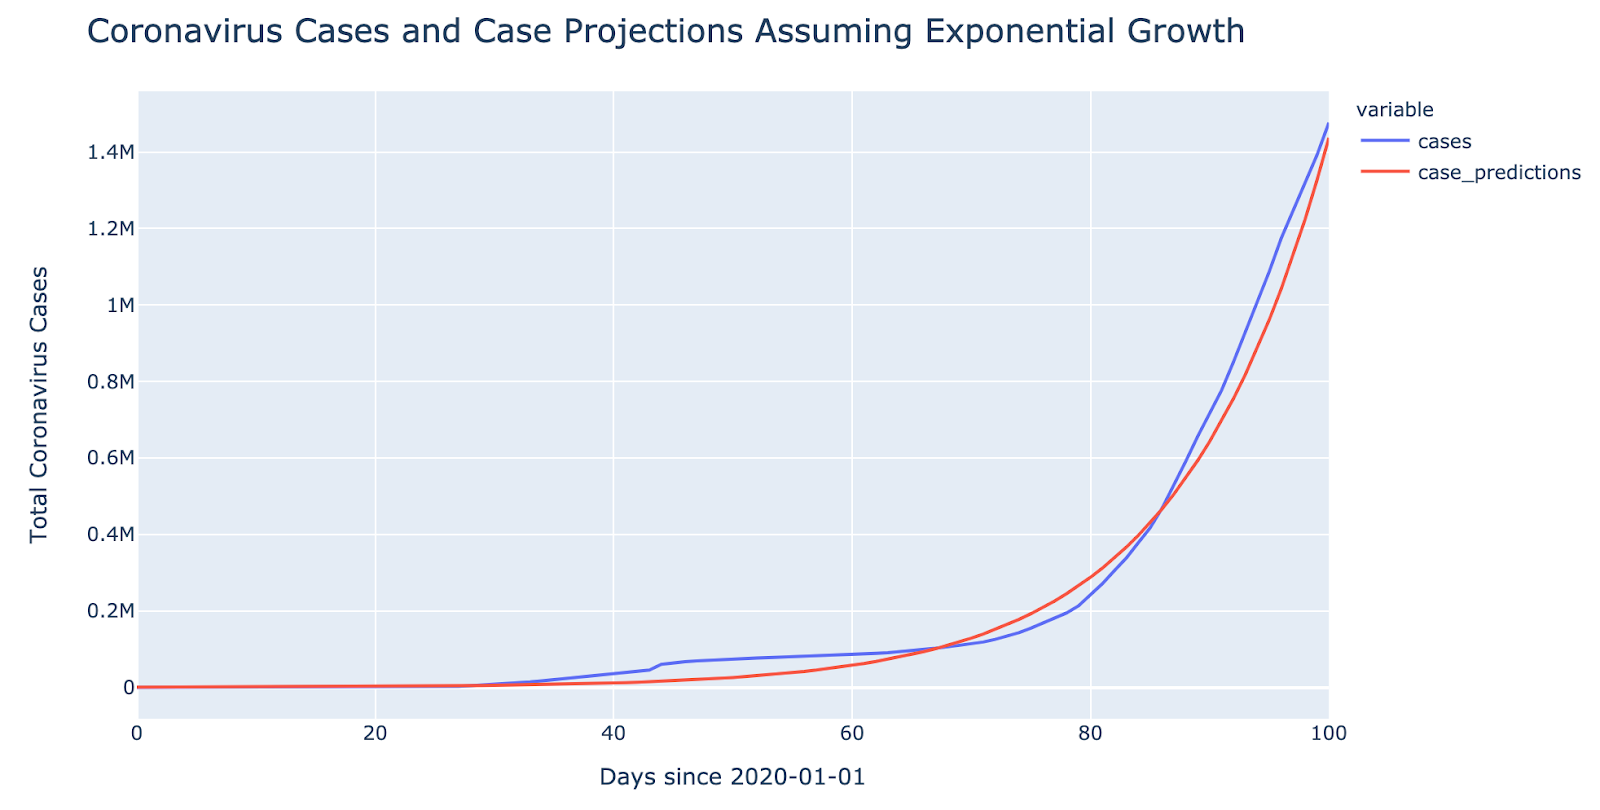
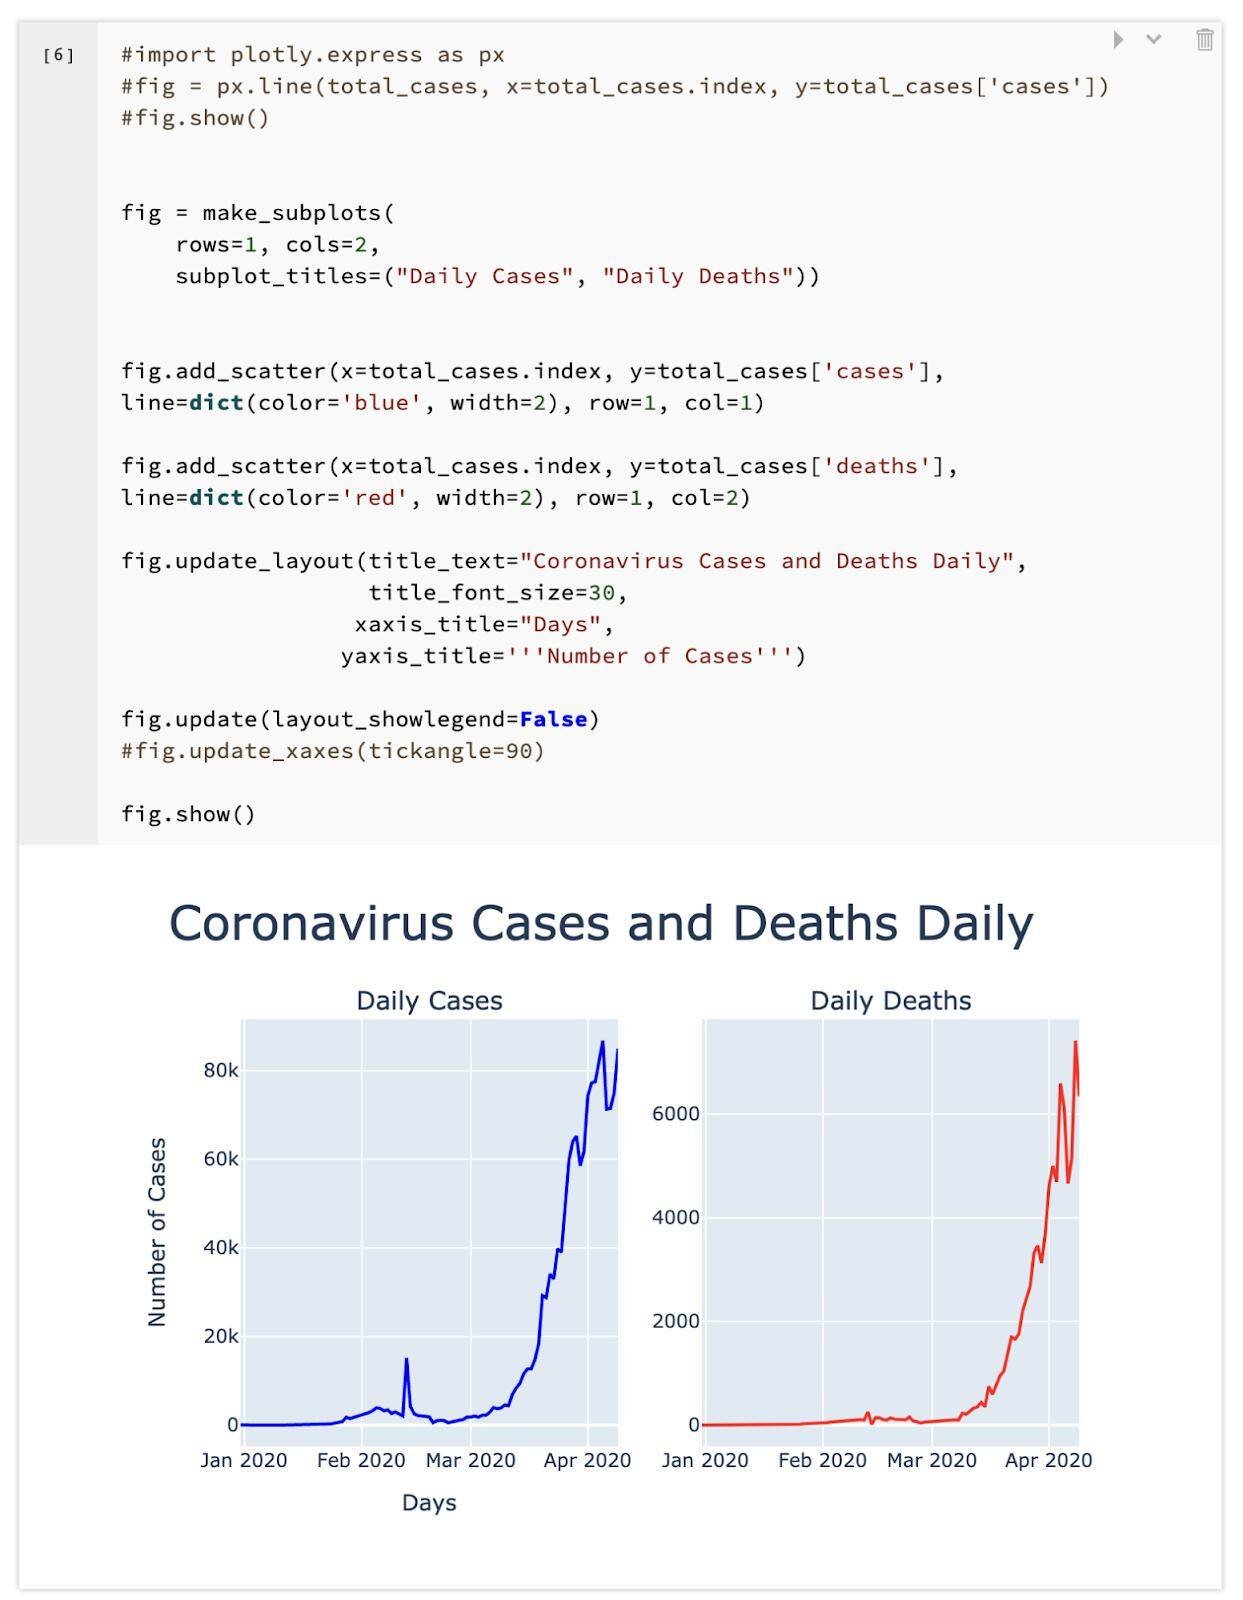
The data science team at Avenga used a statistical approach to evaluate the number of cases and death from COVID-19. The company has a data services department that works with datasets and is involved in machine learning projects, predictive modeling, and in advanced analytics. The data science team compiled exponential and polynomial charts depicting COVID-19 pandemic, which you can see below:

We often hear the term “exponential growth” in the context of COVID-19. Exponential growth is a mathematical model that is often used to model the outbreaks of infections. Our minds normally perceive the growth in a linear (or arithmetic) way, and it’s not that easy for us to grasp how quickly the virus spreads when the growth is not linear, but polynomial or exponential.
However, empirical research shows that the many infectious disease outbreaks, including COVID-19 display not exponential, but sub-exponential or even polynomial growth in the early stages of the epidemic.
First, let’s assume that the coronavirus pandemic spreads at an exponential rate. Exponential growth formula is the following:

According to this formula, we can model the coronavirus pandemic. At any given time t, there is a number of cases n0at the initial moment of time and a growth factor b, that depicts the number of people infected with by each sick person.
If we take into account that initially there has been one infected person, and every person infects 2 people ( b = 2 ), we will have one billion infected people in one month.
The following two charts show the coronavirus cases and death trends assuming exponential growth. Polynomial growth is higher than linear growth and yet it’s smaller than exponential. Polynomial growth means some number has some exponent and it’s growing at a rate of this exponent. The exponential growth usually means the number of cases is doubling every certain x days.
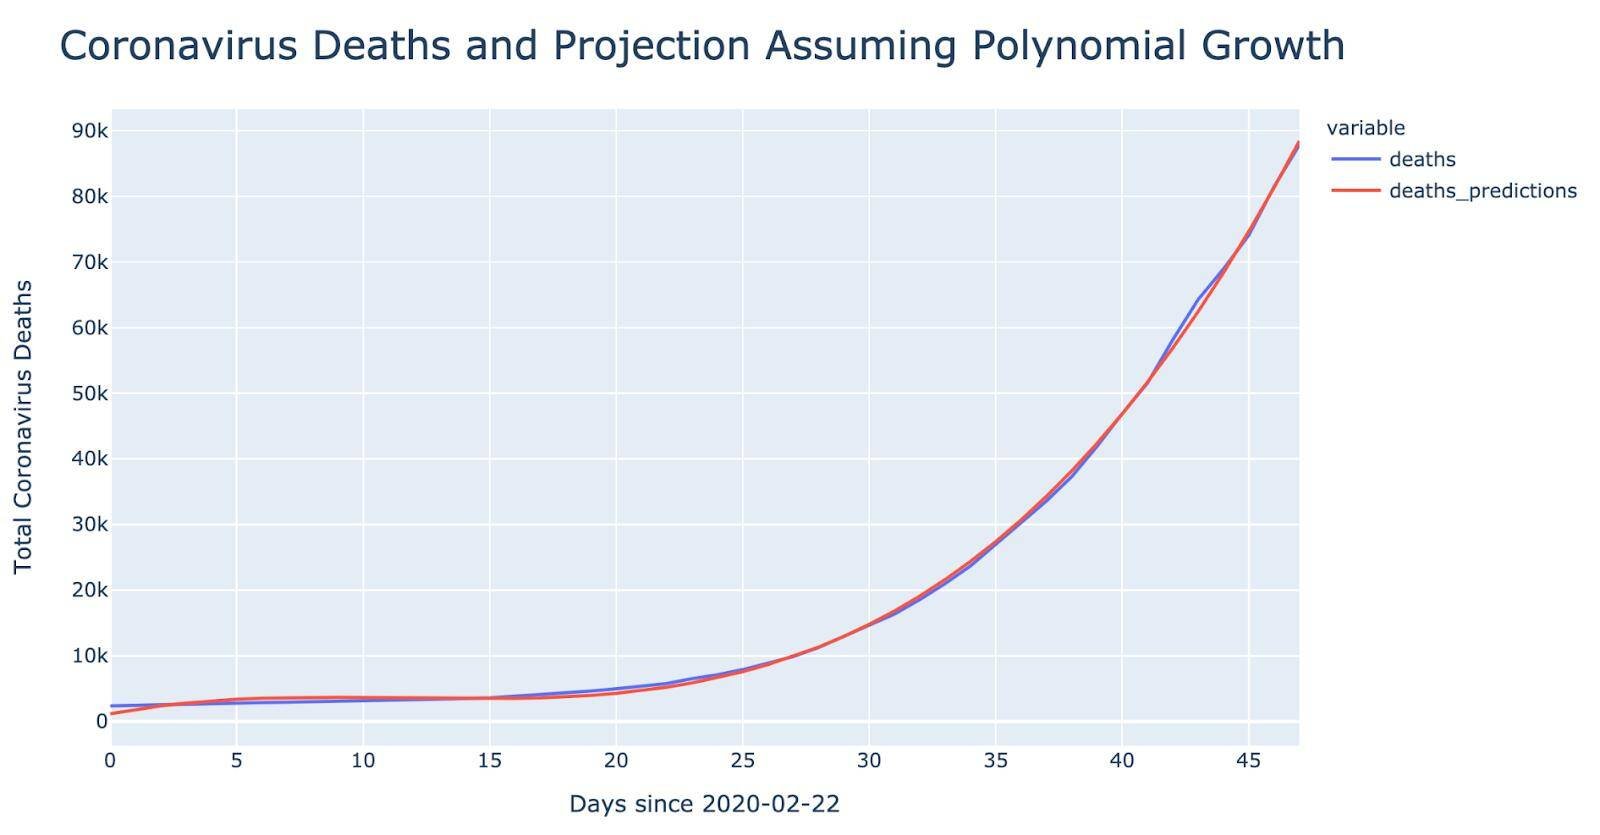
On these two charts, you can see the coronavirus cases and death trends assuming polynomial growth.
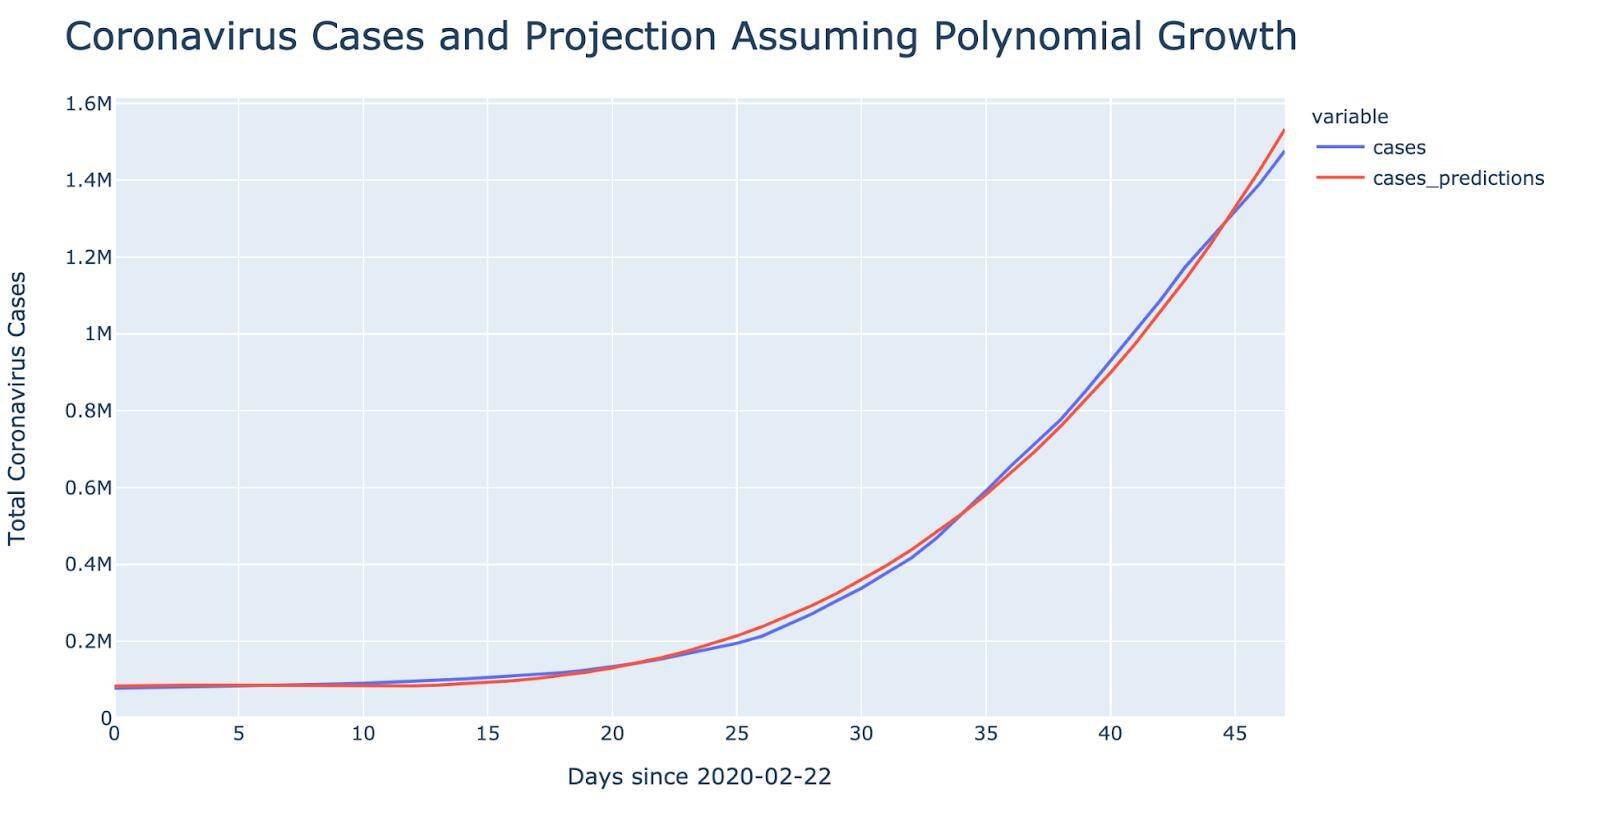
As we can see from the data science analysis, the coronavirus pandemic curve had exponential growth initially. As per our calculations, the exponential curve from the above-mentioned equation shows a growth rate of 1.08. This means that for every 100 infected people spread the disease to 8 more people daily. Although the number seems to be small (thanks to preventive measures like social distancing and quarantine), it still adds a big number of new cases to the total amount. Without quarantine, the number of new cases would have been much higher.
Insights from data science analysis
Countries that have introduced quarantine early have a lower number of coronavirus cases.
The countries that have introduced quarantine and social distancing rules before the first case of COVID-19 was registered in their territory have a general tendency to have a lower rate of infection spread than the countries that introduced strict quarantine later. For instance, the average number of infected people per one million of the population in ‘early bird’ countries is 150. While in contrast, the ‘late’ countries have 345 infected per one million. That is a 2.3 difference. We cannot emphasize more how crucial it is to follow the quarantine and social distancing rules, as it makes a substantial effect.

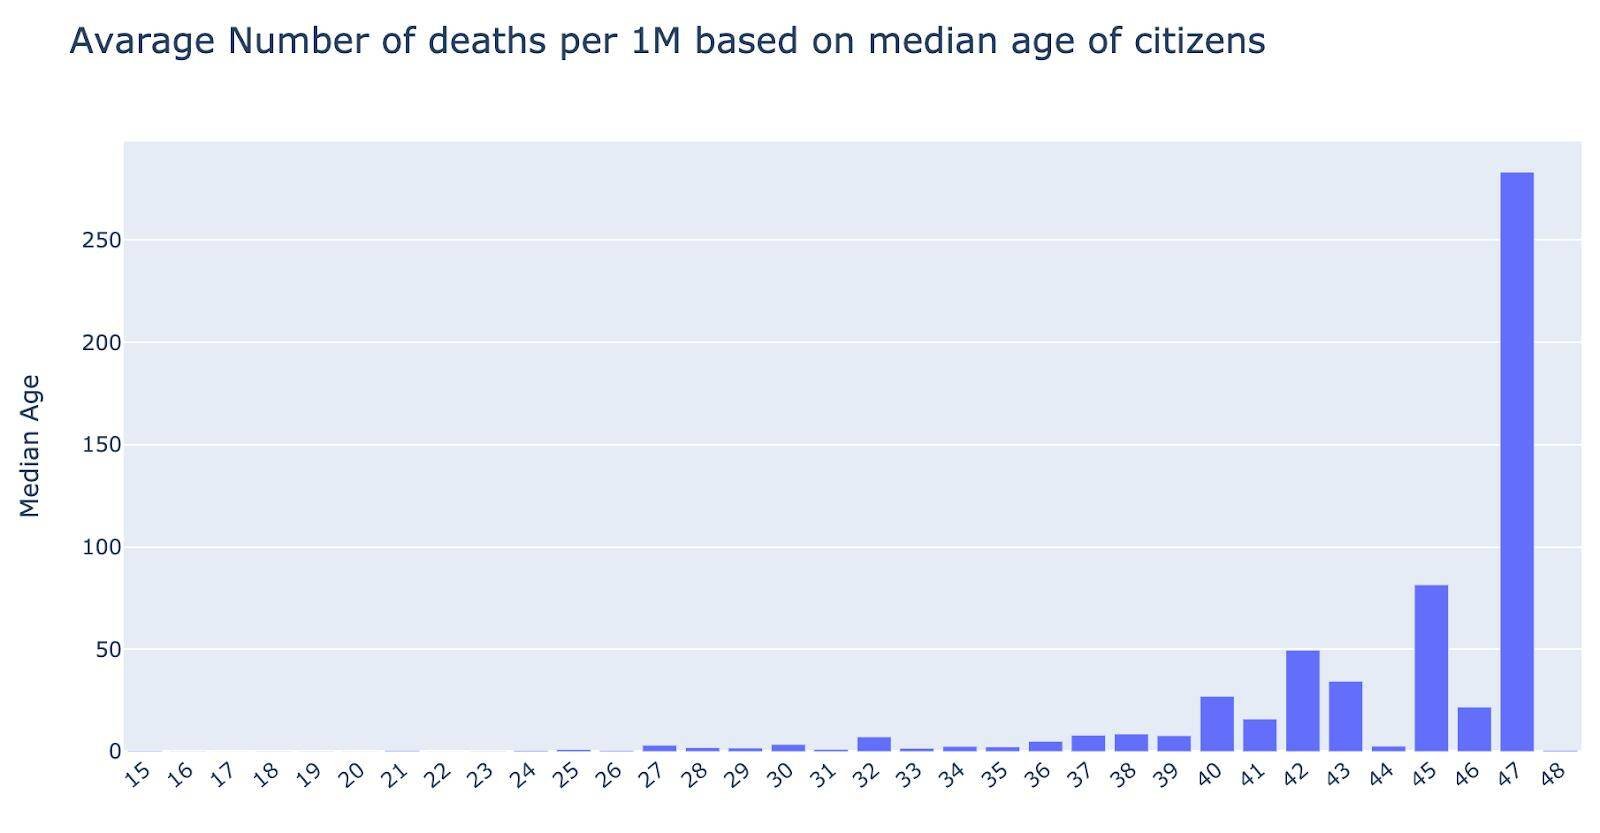
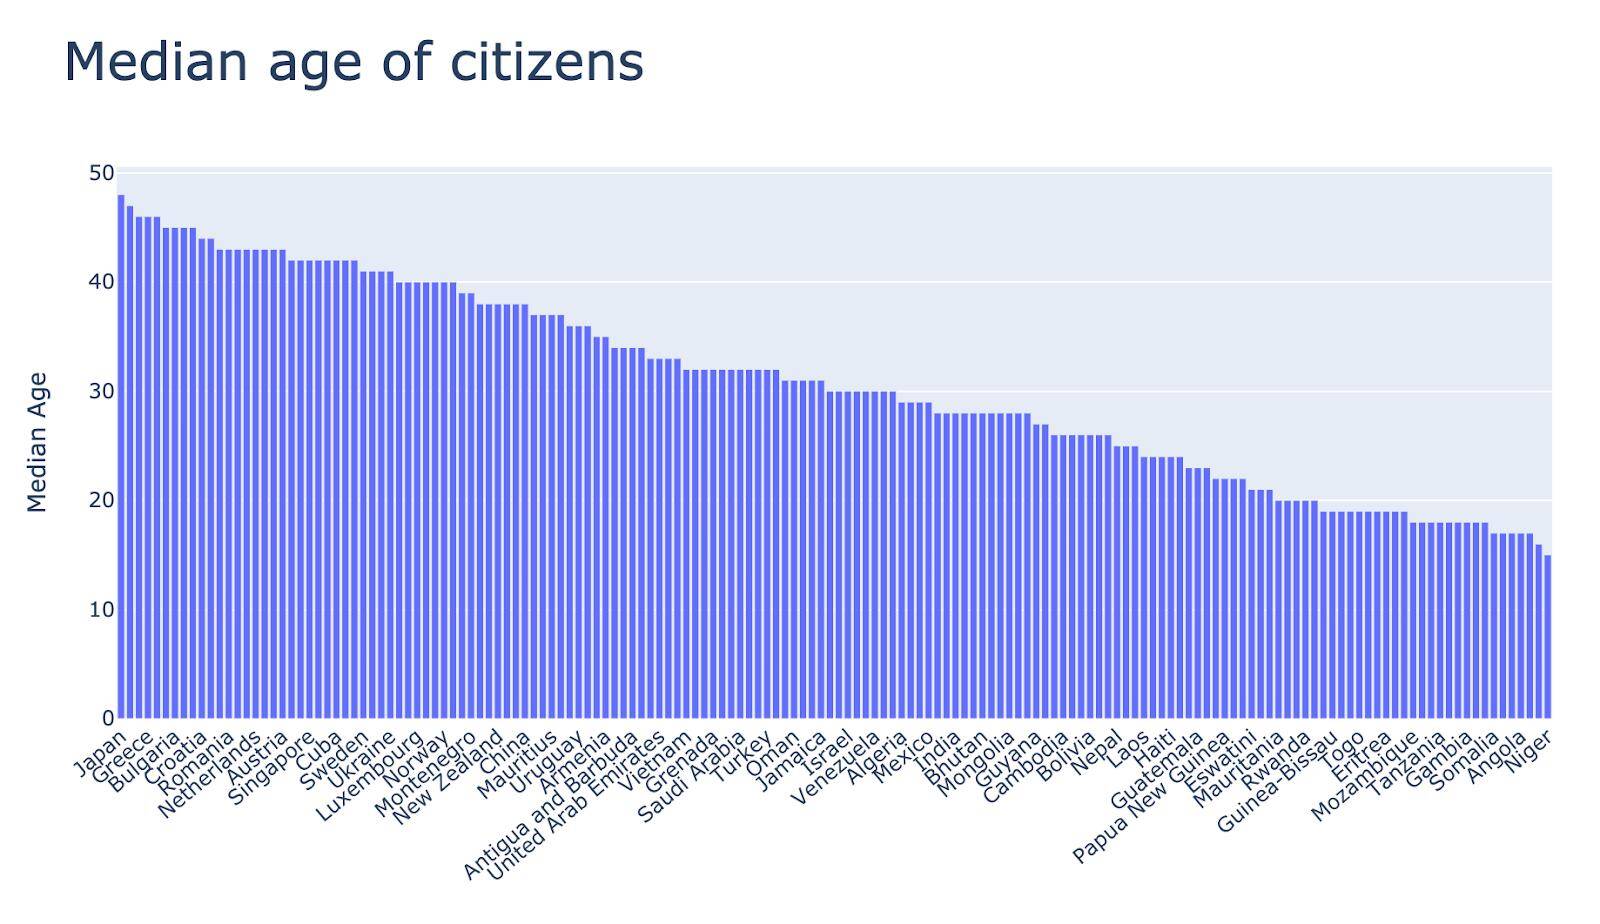
COVID-19 is more dangerous to senior citizens
This chart supports the claim that te COVID-19 is more dangerous to senior citizens, as the mortality for senior citizens is higher. That’s why the countries with high median population age have higher mortality rates than the countries that have more youth.
The questions that interest everyone: how do we predict the when and how many people will be infected and when the virus stops spreading. If we perform a predictive analysis, we will get a very ambiguous hypothesis that the situation is static. However, in fact, the coronavirus situation is anything but static.
There’s a number of factors that block us from compiling a robust data model. Firstly, it’s difficult to predict how many citizens will adhere to quarantine policies, and how many will neglect it. Secondly, it’s a bit challenging to estimate how quickly the virus will spread to medical personnel. What is more, we don’t know how many nurses and physicians will be available at the time N. Lastly, we don’t know the prospective date when the curve will start flattening.
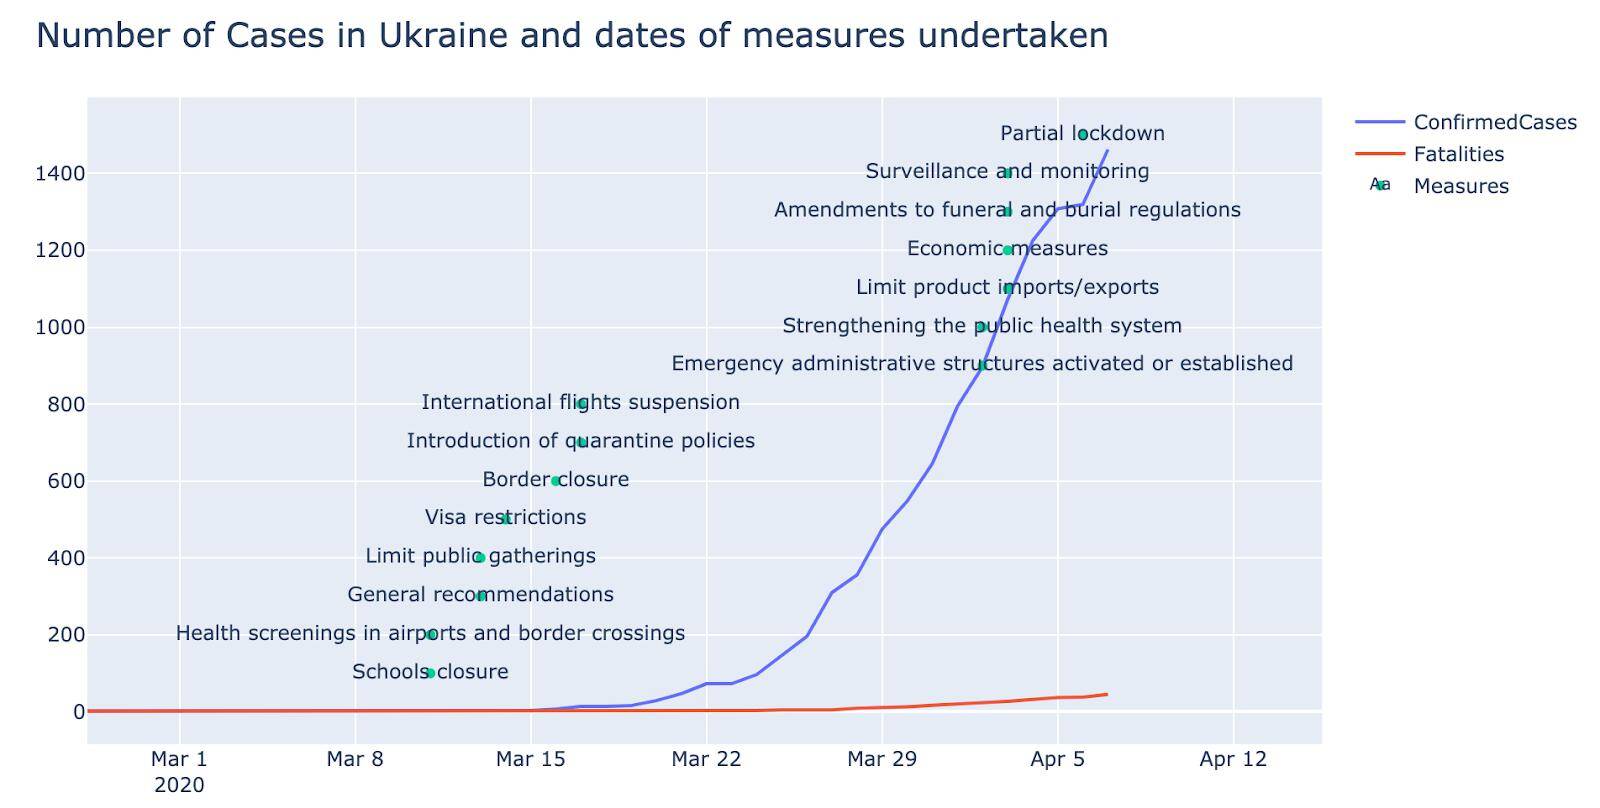
Assess the Impact of Implemented Strategies
Various countries have chosen different approaches to fight the coronavirus, from full lockdown to resuming complete openness with minimal social distancing. From mass testing to testing only suspect cases. All of these strategies have produced different results, both health and economy-wise. It’s up to data scientists to gather all the resulting data and assess the impact of different scenarios. Based on this, crisis management bodies can adjust and change their strategies on the go.
Help Handle Contact Tracing
One of the most effective ways to minimize the spread of COVID-19 is contact tracing. It involves tracking down all of the persons that have been in contact with the infected patient and testing them or at least instructing them to self-isolate. This process, especially in countries with a larger number of confirmed cases, requires an enormous amount of manpower, time, and effort. The data scientists are trying to come up with a way to speed up this procedure and make it simpler and easier.
For example, a group of data scientists and health experts at Oxford University have developed a solution that employs mobile phones and sends messages to all of the contacts of the infected individual. This eliminates the need to manually call each one, thus significantly reducing the time required to trace and inform the contacts of a particular patient.
The widespread use and omnipresence of mobile phones and smart devices in today’s world have enticed other scientists to develop their own solutions on this basis. There are currently ongoing projects involving wearable devices such as a Fitbit to track the spread of the coronavirus. The information these gadgets can provide on a person’s heart rate and other health indicators has proven to be useful in monitoring the advancement of COVID-19. The Chinese government has utilized mobile data and movement indicators to identify the possible areas of high risk. Other scientists have tried to employ information on short-distance communication via Bluetooth. Of course, the implementation of these methods has been tricky due to various confidentiality issues and data researches have to be careful not to step over the boundaries of people’s privacy.
Tracking the Publications Regarding the Pandemic
Some scientists are working on extracting the relevant data from literature published on coronavirus measures, guidelines, best practices, drugs developed, and clinical research. They hope to develop an up-to-date database that can provide information on different approaches, results, and affected demographics that can serve as a ready-made guidebook for healthcare professionals and researchers. This can help researchers to quickly and easily access the specific information they need.
Help Businesses Respond to the Crisis
Businesses all over the world are probably facing the toughest challenges in their business’ history. Many of them are using data analysis to help tackle these difficulties. Forecasts and predictions on how a crisis impacts supply, demand, and customer behavior devised by data scientists can help companies develop contingency scenarios and start recovery processes. Early detection of business trends during the COVID-19 pandemic provided organizations with the information needed to implement adjustments and change their operations if needed. This includes finding alternative ways to produce, market, and sell goods and services.
Working Towards the Future
The coronavirus is novel and many variables make it difficult to predict what the final outcome will be. Total numbers of infected individuals, death-toll, and impact on the economy are all unknown at this point. Still, data science gives us the best chance to at least get some sense of the post-pandemic world. Once the pandemic dies down, there will be no new cases to report and track, so it’s vital that the information gathered now is stored and recorded properly. Lessons learned during these difficult times might be painful, but should serve us, so that we are better prepared for the next time disaster hits. Information gathered and analyzed by data scientists should provide a framework for improving the health, economy, scientific, and social systems. All of the measures and approaches that were undertaken to tackle the virus will have to be carefully evaluated and rated by their justifiability. Governments will need to reach for new thoughtful legislation that will better prepare us for the next wave of the coronavirus or some other virus while keeping in mind the personal privacy and human rights that were often neglected during this crisis in many parts of the world.
Challenges Data Scientists Face During the Pandemic
The main nemesis of data scientists is unreliable and false data. Faulty and inconsistent samples will usually lead to wrong conclusions, and during the current crisis, scientists have had to deal with more than their fair share of bad data. Different countries had different ways of reporting coronavirus statistics. Huge discrepancies in the number of deceased in countries applying similar strategies often had to do with what was considered a COVID-19 related death. Some states reported only the deceased with no pre-existing illness while others treated any patient who passed away while infected as a coronavirus death, no matter the previous health condition.
The different approaches to testing also produced unreliable data. While some countries, such as South Korea, conducted mass testing of their population, others restricted testing to only the self-reported cases and not even to the contacts of the infected patients. The only country that managed to conduct thorough testing of the majority of the population is Iceland, which is why their data is particularly valuable to data scientists. In other parts of the world, researchers faced probably thousands of asymptomatic and lighter cases that went unreported.
Often, the irresponsible behavior of the news media outlets and social network users provided a lot of static, and redundant and false information. Combing through all of this unreliable data made the already difficult task of data scientists even harder.
Also, there have been reports of certain governments intentionally covering up the true numbers regarding the COVID-19 pandemic. For whatever political or internal reasons, this made already scarce and insistent information even more suspect.
Besides this, researchers often had to deal with delays in data collection and the very access to data. Remember, data scientists can’t count people on their own, but only work based on the reports they receive. In a situation demanding an immediate response such as this one, time lags in reporting sometimes stretched to 48, to 72, or even more hours. Add to that the period of incubation for each infected individual and you can get a picture of the data mess scientists often found themselves in.
There are ways that data scientists can approach reliable and false data. They need to look for alternative sources and cross-validate any information that reaches them. Compare the datasets received in various places and look for inconsistencies. Since researchers have no way of controlling how data is collected, sometimes the best approach is to concentrate on extracting data from verified quality samples.